Problem with high-leverage observations
High leverage is a good thing if you know that all data arose from a normal linear model of the form
![]()
However in practice, we are never certain that all data came from such a model. Possible problems include outliers, curvature, non-constant variance and non-normal errors. If a normal linear model does not underlie all the data, high leverage points can badly affect the least squares estimates of the parameters.
The potential damage from high-leverage points is greatest when there are outliers in the data — response values that are unusually far from the regression line.
If a high-leverage point is also an outlier, it will cause the least squares line to be much less accurate.
Outliers and errors
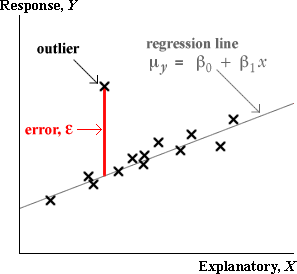
An outlier is a measurement that does not fit in with the pattern exhibited by the rest of the data. By definition, an outlier does not satisfy the normal linear model that fits the rest of the data, so it should be omitted from the analysis.
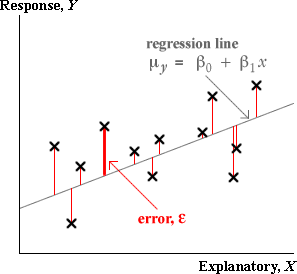
In a regression situation, an outlier corresponds to a large
error, ![]() .
.
In a scatterplot, the point is unusually far above or below the regression line.

Outliers and residuals
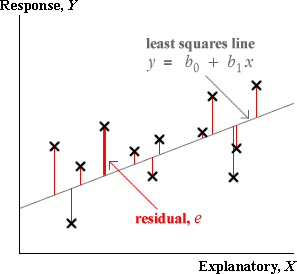
Unfortunately, in a real data set, the errors are unknown, so we must use the residuals from the least squares line as estimates of the errors. The residuals can be used in a similar way to give information about whether there is an outlier.


It might be expected that the outlier could be detected by an examination of the residuals from the model. However the high leverage usually results in a residual that is no larger than the others.
An examination of residuals often fails to detect an outlier if it is a high-leverage point.
Illustration
The scatterplot below shows a data set and the corresponding residuals.
The cross on the far right can be dragged with the mouse. Initially, the diagram shows what we would ideally have hoped to see in the residuals — the other points are close to a straight line, so if the final cross is dragged away from this line, we would have hoped that it would result in a large residual.
This is not what actually happens. Choose What you actually get... from the pop-up menu at the top and drag the point again. The least squares line is pulled towards the point, so when it is dragged away from the line followed by the other points, its residual is smaller than might be expected and the residuals for the other points are larger.
This is especially evident when the point being dragged has an x-value of around 4 — i.e. when it is a high leverage point. Drag it down to a y-value of about 40 and observe that its residual is no more extreme than those of the other points.
Do not rely on an extreme residual to tell you whether a high-leverage point is an outlier.
High-leverage points
High-leverage points have a large potential to affect the results of an analysis if they correspond to observations that do not follow the linear model, but the resulting problem may not be evident in an examination of residuals. It is therefore important to identify high-leverage points.
From their definition, it can be easily shown that all leverages sum to 2.

They therefore have an average value of 2/n and their minimum possible value is 1/n. A rule-of-thumb is therefore to carefully examine any points whose leverage is more than twice their average value:
Carefully examine points with leverage hii > 4/n
It is important to note that high leverage does not necessarily mean that there is a problem.
High leverage on its own does not indicate that something is wrong with the normal linear model. Leverage only depends on the explanatory variable and the actual response value may still be consistent with the model
Later in this section, we will investigate whether a high-leverage point actually does influence the results.